Adobe Analytics Account Usage Logs: A Checklist of Surprises & Should-Knows
The account usage logs of Adobe Analytics offer a lot of cool data to monitor if the Digital Analytics team is doing their job. However, they are not without pitfalls. A Project View may not be what you think it is. How fresh is the data? And how do you deal with the different logging languages? A checklist and some code examples should help.
You, the Adobe Analytics admin, put a lot of work into bringing your data to the masses. You also want to know if your data democratization efforts are fruitful. In my previous article, I showed 3 key insights to monitor (logins, workspace views, churning & burning users) and how the Adobe Analytics Component Manager for Google Sheets can get you these insights fast and conveniently.
A wealth of logs, a wealth of legacy
However, you may have other use cases for the account usage logs. They offer a lot more events (this list is incomplete, Adobe!) than logins and workspace views. Since the account usage logs are basically a legacy feature of AA that was made available via the API 2.0 not so long ago, the logs have a lot of legacy in them. Thus, I thought I’d make your life easier and compiled a list of things to watch out for (again, see the guide by Frederik Werner if you are interested in how to get going code-wise).

The List of Should-Knows and Surprises
- You can at max pull 90 days at once. I recommend even smaller packages to prevent timeouts. Especially if you are working with large accounts, getting 90 days of data can take 10 minutes or longer and may lead to timeouts. For my Google Sheets Component Manager, I use 30-day intervals.
- Unlike regular Adobe Analytics data, logs are not deleted after your retention period (typically 25 months), so you can go a couple of years back.
- Adobe’s login mechanisms have changed over the years. In recent times, I don’t get the “friendly auto-log-out” anymore as much, so that will have an impact on total logins. Better focus on logins, counted once per user or at least day.
- Logs are near real-time. In my experience, they usually are there after a couple of minutes already if not sooner.
- Use event types to make your queries efficient and fast. No need to get all the logs if you are just interested in logins (event type 2) and Workspace project views (one of the many actions subsumed under event type 23). For example, it is a lot faster to do two queries, one for type 2 and one for 23, instead of pulling all logs with one query and then filtering out 2 and 23 afterwards. And it saves you valuable memory, which is especially important in cloud-based setups.
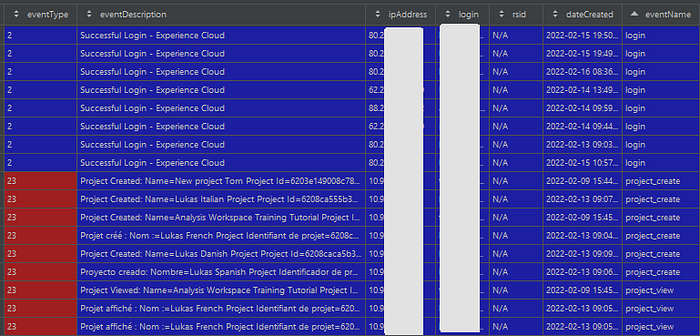
- As mentioned, event type 23 contains a lot of Workspace actions: View, create, update, delete, share, and potentially more. You need to look into the eventDescription column to find the necessary detail, but …
- … unfortunately, that eventDescription column is in the language of the user who was logged, which makes it painful to put this column to use. That cost me a lot of extra time to work around.
- The general rule is: If the user can switch to another language in the Analytics interface, the logs are also in that language. So while you can e.g. set your Experience Cloud language to Danish or Italian, there is no Danish or Italian Analytics interface (it remains in English). Thus, there are (luckily) no Danish or Italian logs (yet).
- However, Analytics offers an interface in e.g. French, Spanish or German (with abysmal translations like “Entry Page” becoming “Eintrag Seite” (literally “‘entry into a book’ page”), or “Paid Search” becoming “gebührenpflichtige Suche” (‘fee-requiring search’, as if there were government fees on using Google!). Thus, you will have logs in these languages, aka data abnormalization at its best:

It only gets messier: The French version and potentially others have weird whitespace characters (which Python’s pandas shows as “\xa0”). The easiest hack I found to get rid of those is to split the column by spaces and then join it again:
# Removes \xa0 characters that are found in the logs in various languages
logs_df['eventDescription'] = logs_df['eventDescription'].str.split().str.join(' ')
(As for any Python code example, feel free to shame me, I am an amateur)
After that, you can split out the part before the first “:” (more or less, see actual regular expression below) to get a “raw” event name. Then, you map that raw event name to a “normalized” event name (the code below gives you also the English, German, French and Spanish versions of the “view project” and “create project” events):
# The example assumes we have a logs extract that contains only logs of type 2 (logins) or 23 (Workspace Events)# Extract the Raw Event Name from the eventDescription
en = logs_df["eventDescription"].str.extract('(^[\w ]+)($|: | \- )', expand=True)
logs_df["eventName_raw"] = en[0].str.strip()# Map to normalized Event Names
view_variants = ['Project Viewed', 'Angezeigtes Projekt', 'Projet affiché', 'Proyecto visualizado']
create_variants = ['Project Created', 'Projekt erstellt', 'Projet créé', 'Proyecto creado']

def do_map(row):
    if row["eventType"] == 2: # logins can be simply recognized by eventType 2
        return "login"
    if row["eventName_raw"] in view_variants:
        return "project_view"
    if row["eventName_raw"] in create_variants:
        return "project_create"
    return ""# generate the normalized event name
logs_df["eventName"] = logs_df.apply(do_map, axis=1)
In this case, we have only login, view and create event names in our new “eventName” column. Let’s throw out everything else so we have a clean dataframe to work with:
# Filtering out create and view events
logs_df = logs_df[logs_df["eventName"] != ""]
This looks much tidier (see the “eventName” column to the right):
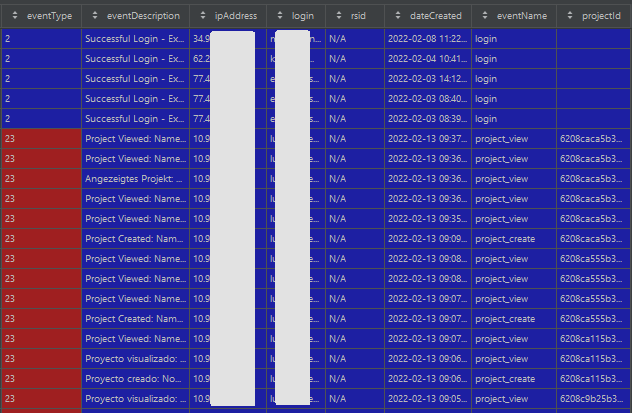
Now we want to know which workspaces were viewed or created. So we need to extract the project ID, again from the absurdly formatted eventDescription column. We need another hacky regular expression for that (and good faith to cover all edge cases in all languages):
regex = re.compile("=([a-z0-9]{24})( |$)")  # project IDs are always 24-char hashes

pid = logs_df["eventDescription"].str.extract(regex, expand=True)
logs_df["projectId"] = pid[0]
logs_df["projectId"] = logs_df["projectId"].fillna("")
We finally have something we can now do our calculations on (e.g. extract the number of users with at least one login per month etc.).
But wait! There are more surprises in the logs:
- Don’t expect consistency with the projects API: You would expect that a workspace that had its “created” event on January 24th would also have January 24th as the “created” date in the projects (aka Workspace) API? That is not always the case. Similar things were observed with the “modified” date (projects API) and the “update project” event (logs) not being in sync. According to Adobe support, we should rather trust the projects API in cases of doubt, since the usage logs are what they are: “legacy” (but so useful still!)


- A project view event may not be what you think it is. When I create a new workspace, there is only a “create” event, but no “view” event. That is not wrong, but easy to miss. To get a proxy for “relevance per Workspace”, I thus recommend taking unique login IDs per workspace with at least a create or view event.
- Logs were lost in Feb-March 2020: See a strange dip in the data in Feb 2020? For all clients I checked, nearly all “view project” events and other Workspace-related actions (but not “create project”) seem to have been lost in February and early March of 2020.
Found anything else to note in the account usage logs? Send it to me or mention it in a comment to this post!
P.S.: Want to just click a button to get all this account usage data neatly visualized without having to waste days to normalize it first? Just request a free 14-day trial & demo of the Adobe Analytics Component Manager for Google Sheets. With it, you can also do many other things, e.g. one client just last week identified and deleted the 13,500 segments, calculated metrics and date ranges nobody used anymore and now has a much cleaner and faster Workspace component rail. All that took just about one hour.
And P.P.S.: Thanks to Lukáš Čech, the former Digital Analyst and now comedian (check out his tour of Czechia with no other than Avinash Kaushik (sort of)… ;)) for the inspiration to this article.