Beyond the Conversion Rate — powerful Analytics E-Commerce Metrics to Rank Winners and Losers
How “Runner” and “Bummer” scores rank products and make simple reports actionable
If you have followed @frederikwerner’s blog, you have seen some powerful examples of Adobe Analytics Metrics. I am a huge fan of Adobe’s Segment-based Calculated Metrics, because you can condense so much complex info into a single column.
My favorite examples are the “Renner” and “Penner” metrics, which loosely translate to “Runners” and “Bummers”. I have been using them for years, and the simplicity and actionability that goes with them makes them an every-day tool for my E-Commerce clients.
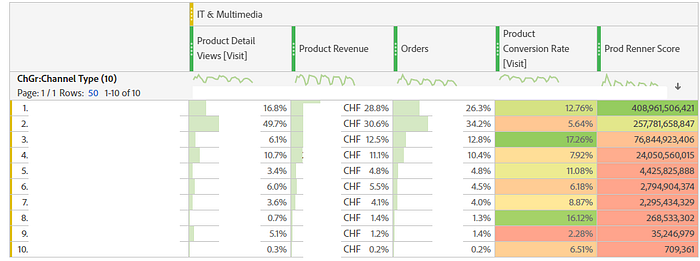
Performance in Terms of Traffic, Orders and Revenue Combined
These metrics allow to rank Products, Categories, Brands, Subcategories and even Campaigns, Search Terms and more in terms of how well they utilize the traffic they get in terms of generating Revenue.
So a “Bummer” is not simply a product that sells poorly, and a “Runner” not simply one with a lot of Revenue. Instead, the scores put their performance in relation to traffic and revenue. E.g. an expensive Order boosts the “Runner Score” more (and lowers the “Bummer Score” more) than a cheap Order (assuming that cheap products have higher Conversion Rates).
Why not simply the Conversion Rate?
If you only looked at simple Metrics like Product Conversion Rate (in GA “Order-to-Detail Rate”) or “Revenue per Detail View”, you always run into problems with all those zero-Order products which all have 0% Conversion Rates, and you have to compare all products as if they were made equal, i.e. as if they were expected to reap e.g. the same Conversion Rate.


The formula for the “Bummer Score” (formulas are explained in the comments):
Product Detail Views [counted once per Visit] * e^((-Orders/3)*(Revenue/Prod Detail Visits))
In Adobe’s Metric Builder:

You can experiment with this score for your shop (e.g. try another constant than 3, which is there to not make a single Orders have too much impact).
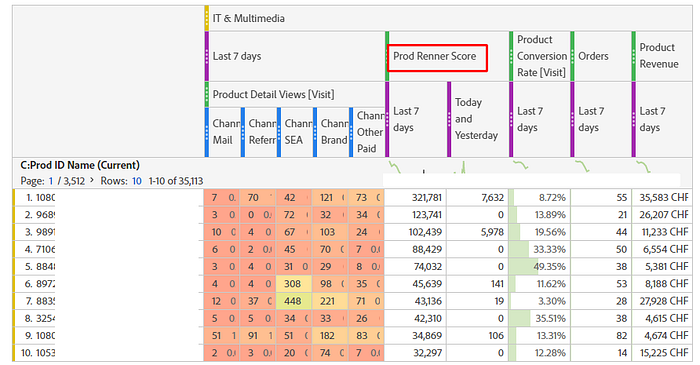
The “Runner Score”
Likewise, the “Runner Score” shows Products/Product Groups/Categories etc. not simply in terms of how much they sell, but how well they sell compared to the traffic they get, and the price at which they sell:
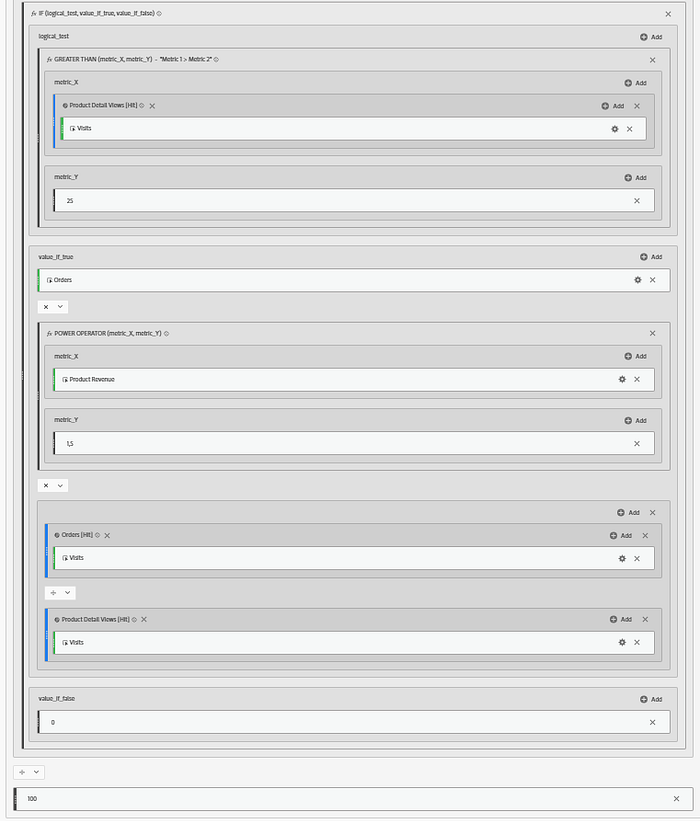
The formula for the “Runner” Score is:
IF (Product Detail Views>25):
THEN: (Orders * (Product Revenue ^ 1.5) * Product Conversion Rate) / 100
Inside Adobe Analytics:
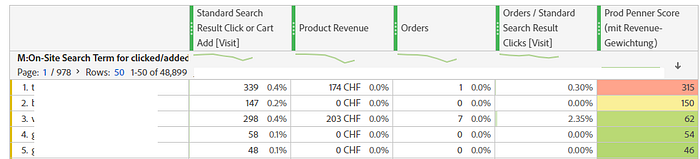
That being said, you can apply these Scores not only to Product-scoped Dimensions, they are also useful to rank Marketing Campaign Performance or even Search Terms. Example:
The scores are by no means perfect. Potentially some Data Scientist can find an even better score for you. E.g. Bummer Scores work less well for large categories and the longer the time frame. But that is not their aim. They are made so you can quickly react to short-term trends on a low-granularity level. And they do a great job for me every day and are part of every Category Manager dashboard.
The next step: Bummers and Runners as signals for Ad Campaigns
At my previous employer, we even used Bummers and Runners as signals for Marketing Campaigns. By automatically exporting the Top x Runners and Bummers per Category (with the marvellous ProductsUp in-between to join that Adobe data with the rest of the product catalogue), we gave the algorithms a signal to bid more on Runner products and throw Bummers out for a while. The Runners were the products shown in Display Prospecting campaigns (for acquisition of new users). They were also used in Product Recommendations in Newsletters for users where there was not enough user-specific data to show personalized products — and I remember cases where recommending the overall Runners performed better than recommending something based specifically on that user’s data (e.g. based on which product she had bought/seen etc.).
So Product Rankings go beyond better Ad-hoc Analysis and Reporting. Since they rank products better than a simple Conversion Rate or Revenue metric, they are also helpers for Marketing Campaigns.
So take some time and try to use your creativity and some math to go beyond the simple, but short-sighted (and boring) standard metrics. ;)