When the Past Changes: The Technology Behind Profit Margins & Actual Revenue in Analytics (Part II)
Datacroft Cost Importer, Consistent Marketing Channel and Campaign Setup, Google Cloud, and Transaction ID Data Source Imports
Part I showed how important it is to become aware of “Actual” Revenue to counter the “Tracked” Revenue, and why a true Performance Marketer should not look only at the (Tracked) Revenue per Cost (misleadingly called Return on Ad Spend (ROAS)), but at the Profit Margin per Ad Cost. Part I also showed: For such a complete picture, you need to blend a lot of data sources. Thus, part II highlights the components required to get all that data together into Adobe Analytics. The “changing past” becomes a special challenge here.
Steps to Enlightenment in E-Commerce Analytics
Let’s start with the steps to enlightenment of a good E-Commerce data setup. Each steps integrates more and more siloed data sources.
Step 1: Know your Conversion Rate and Revenue per Visit(or)
This can be achieved by a solid Analytics E-Commerce tracking setup alone and would fill a book of its own. To keep it short, make sure you track on-site search terms and interactions (start, view, click/add-to-cart), internal (on-site) campaigns as well as external campaigns (ads, emails), group them into one or more sets (via Classifications) of Marketing Channels, etc.. Adobe’s wonderful E-Commerce data model, in most cases, makes all that data automatically correlatable to your product data and the product interactions you track (list view/click/search view/search click/detail view/add to cart/wishlist/shopping or comparison list/comment/cart view/checkout steps/orders etc. (add any other product interaction here).

The richer your product data, the more nuanced your analysis capabilities get. For that, track temporary product attributes (like stock level, purchasability, price range, list on which (or search term for which) a product was clicked) via Merchandising eVars, and import permanent attributes (name, brand, category, responsible Category Manager etc.) via Classifications to not overload your dev team by asking them to add more and more properties to the Data Layer (for Adobe Analytics, only temporary attributes need to be in the Data Layer!). The client at hand e.g. has over 40 Product Classifications. Remember that Classifications are almost like free additional eVars (Custom Dimensions), so abuse them as much as you can! Normalize your metrics to count once per Visit (and do that via segment-based Calculated Metrics, NOT via the “Visit” setting the Success Events configuration interface), as Hit-based metrics tend to skew things a lot in E-Commerce (still do not understand why Google Analytics’ “Enhanced” E-Commerce Metrics are still all Hit-based only).
Step 2: Know how much you pay for your Traffic and your Revenue
This requires …
a) a consistent Campaign Tracking Setup where all your external campaign links contain a “Tracking Code” (URL parameters to identify the campaign, e.g. “utm parameters”) because the Tracking Code becomes the identifier for the traffic on your site AND …
b) … the Campaign Cost Importer (which usually also imports Clicks and Impressions). This gets just as tedious as a): In our case, we clearly did not want to set up and maintain connectors to all those APIs (Google Ads, Facebook, Criteo, DV360, etc.). After evaluating some solutions, we decided to go with the Datacroft Campaign Data Importer by Feld M, which specializes in flexible Adobe Analytics cost imports (but offers other imports as well) and also features proactive one-on-one support to go with it. Support is super-important, because from my prior okay-ish experience with funnel.io (which imports data into Google Analytics), I just had lost any faith in cost imports running smoothly all the time. I also did not want to be dependent on an Ad-Spend-based licensing model (like at funnel.io) that “penalizes” you if you spend more, because this leads to avoiding funnel.io for some cost sources just to avoid paying more for it. Other reasons against funnel.io were that it forces you into their utm parameter logic (which can be devastating if you need to retag all your campaigns just to make them funnel.io-compliant), and because of the lack of flexibility when it came to renaming campaigns: E.g. when Campaign A was renamed to B, we suddenly had historical costs for B in Analytics, but the historical traffic and conversions still counted for A.
Things to keep in mind with Cost Imports:
- Your Advertising tools need a matching key, i.e. some exportable attribute that makes it clear to which Adobe Tracking Code a campaign belongs (or a campaign-keyword-ad-group combination if you want your cost imports to run that deep), e.g. the Facebook Campaign Name needs to be the same as the Tracking Code appended to its links (or the Google Campaign ID needs to be part of the Tracking Code — via a tracking template in Google Ads). As mentioned, they also need to be robust enough to cope with changing names of campaigns in the Ad tool (if the name is part of your matching key).
- The past changes! The 600 Euros you supposedly spent on May 2 may be only 400 Euros if you look at May 2 again a couple of days later. This is because Advertising solutions (e.g. Google Ads) often cannot calculate Ad Spend correctly until some more time has passed. Instead, they show you initial temporary estimates. Another reason is click fraud which is often only detected in hindsight. So simply importing data for yesterday is not enough!
- Import the Delta only! Adobe Analytics uses simple summary (aggregate) data Data Sources aka “Conversion Data Sources” for Campaign Cost Imports. So your Cost Importer needs to first export the Adobe data for e.g. the last 60 days, then match it up to the current cost in the Advertising tool, and then import the delta (which can be also negative if the cost for the past is lower now).
- Cost Importers may need to support currency conversion (important in Switzerland where many tools want to be paid in EUR, but customers shop in CHF).
- Especially Category Managers often want to know: How much did I spend on Product X compared to how much I earned with it? The answer is: Not (easily) possible! In other words: Attributing campaign Cost data to individual products or categories is not possible, because Cost is not a product attribute, but a campaign attribute. Moreover, there is no easy way to match Cost to individual Sessions because ad tools give you only cost-per-campaign-per-date summary data (the Google Ads gclid API is an exception, but that one requires a lot of work).
- Even if you ran individual campaigns for each single product, you ended up with the massive “problem” of cross-selling, in other words: Do you really want to match Cost and Revenue for a Campaign only if they are for that specific product? Seems overly simplistic. At least you should have a Tracking Code naming convention which contains an attribute that makes it clear to which product category the campaign belongs, a “Campaign Product Category”:
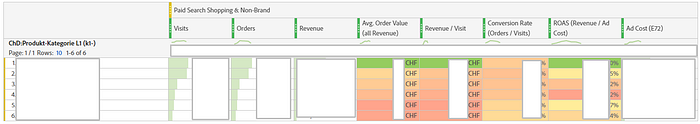
- A nice thing is that, if a Marketing Channel or Marketing Channel Detail (=should always be the Tracking Code for campaign traffic) can clearly be identified by a Tracking Code, you can nicely view Cost by Marketing Channel even though you imported the Cost per Tracking Code and not per Channel.
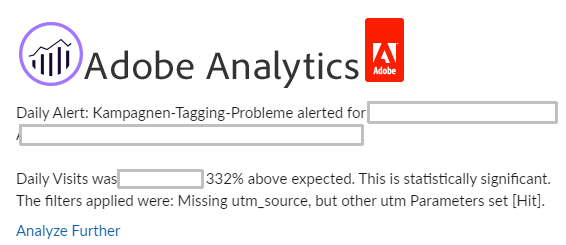
- Monitor the data quality of your campaign tagging (and set up alerts for it) because it only requires an employee change at your Marketing agency to break things again.
So much for the complex topic of Cost Imports. Let’s now get back to the steps to enlightenment in E-Commerce Analytics.
Step 3: Know how much of your Revenue is bottom-line Revenue
Here we are at “Actual Revenue” vs. “Tracked Revenue” again. Both can differ vastly, depending on various factors discussed in part I. Have your BI/ERP/etc. system create a daily export of the “Actual” Revenue per Order ID (Transaction ID) and SKU. From then on, it is similar to Step 4:
Step 4: Know the Profit Margin on that (bottom-line) Revenue
The BI Export mentioned in Step 3 should also contain a column with the Profit Margin, ideally even 2 columns:
- Margin|Actual Revenue at Order Time: available right away, so you don’t need to wait to initially assess your campaigns’ expected profit margins. It is however prone to the same issues as Tracked Revenue (see part I). Nevertheless, it is a good indicator for technical tracking problems (if it diverges a lot from the Tracked Revenue).
- Margin|Actual Revenue at Shipping Time (when it is assumed the product has been or will be paid and leaves stock): This is the true bottom-line indicator. Note that however it is sometimes only available after a couple of days or even later (e.g. if shipment gets delayed).
These columns are then imported as Adobe Analytics Metrics (aka ‘Success Events’). To get this done, Adobe Analytics has a completely underappreciated, under-used and severely under-documented feature that was introduced many years ago (and still looks like it): Transaction-ID-enabled Data Sources. The documentation lacks good examples, and most you can find on the WWW on it is high-level stuff. So I should probably write another article on things you should know before getting started with Transaction ID Data Sources…
In short, Transaction ID Data Sources work this way: When someone orders, you also track “s.transactionID”. This Transaction ID does not show up in the interface unless you use Processing Rules to copy it into an eVar (which you should) to see it. A Transaction ID does not have to be an E-Commerce Order ID, it can be anything you want to associate with data that is not available in the moment the order is tracked, e.g. an insurance company could use it to classify some leads submitted on the website as “qualified” leads, where “qualified” is determined later by a backend application/clerk.
You need to enable Transaction ID Data Sources in the Admin interface (in the “General Account Settings” under “Report Suites” -> “Transaction ID Storage”). Adobe then stores these Transaction IDs in a special way for 90 days (you can extend that time frame via Customer Care) and allows you to import ANY metric+dimension combination for this Transaction ID as a key. This data then appears in any report as if it had happened during the Transaction itself. That means you can correlate anything with the imported metrics/dimensions that you could correlate the original Transaction to (Campaign, Channel, Search Term, List Clicked, On-Site Campaign, Customer Attributes, you name it).
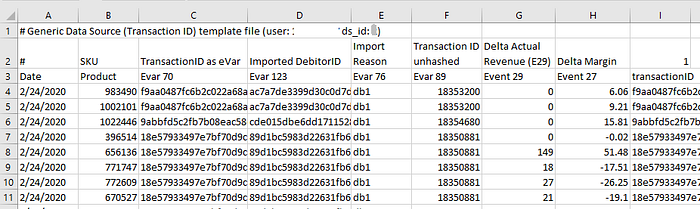
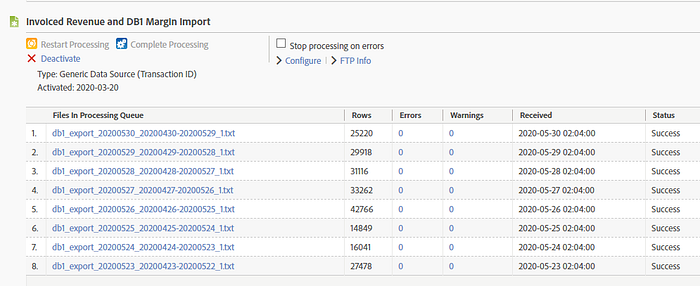
We can e.g. send in Metrics like “Actual Revenue” and “Margin” (Event 29 and Event 27 in the screenshot below), but also Dimensions like “Import Reason” (to differentiate various import types in the reporting interface), an unhashed Transaction ID etc. Importing works via uploading the files to an Adobe FTP Server and then waiting for 2–17 hours (the older the data, the longer) until the data is available in reports.
Like with Cost data, the past changes (e.g. we may know only after some days that an order was cancelled). So like with Campaign Cost, we need to import the delta to the value that is currently in Adobe Analytics. This requires you to first export the current Adobe Analytics Transaction data, e.g. via an “Adobe Data Warehouse” export, then calculate the delta to your last BI Export.
Example: Currently, the Actual Revenue in Adobe for Transaction ID 001 and SKU 123 is 100 CHF, but your last BI Export says it is only 60 CHF (because an item in the order cannot be shipped). => You need to import -40 CHF.
In the screenshot above, for the first 4 SKUs, we import no change (0) to the Actual Revenue that is currently in Adobe, but we add to their profit margins (e.g. we add 6.06 for the first product’s margin). The last product now has a lower margin (19.10 CHF less than what we currently have in Adobe), so we are importing -19.1 CHF to correct it.
The changing past also means you need to always export a longer date range (not only yesterday) from BI and Adobe Analytics, e.g. the last 30 days if you are confident that, after 30 days, 99% of orders are usually shipped.
Only import BI data for Transaction IDs that were tracked by Adobe Analytics! It can quickly happen that in that BI export, suddenly you find data from a different system, e.g. some gigantic B2B order through an API (and not on the website) that skews your data completely. And Transaction IDs that were not tracked cannot be correlated to anything else in Analytics, so their value is limited anyway.
The ETL in-between: How the Data Import is generated
The magic that does all this matching and importing is a Python script on Google Cloud. If you are into namedropping, I use Cloud Functions, a Pub-Sub Handler, a Cloud Repository to store the scripts, Cloud Scheduler to time the scripts, and Cloud Storage to store copies of the imports for debugging. The Python script grabs the exports from the BI System’s FTP Server as well as from the FTP Server that Adobe’s Data Warehouse Exports uses, then matches Transaction IDs and SKUs, then generates the Adobe Data Source imports from it which are chunked into individual files to not run into Adobe’s 50 MB per-file limit (yes…) and then uploads them to Adobe’s FTP Import Server.
This ETL script was actually the hardest part and took most of the time (at least an entire week of my life). And of course, Google Cloud hosts an array of other ETL Import/Export scripts for this client, so setting up your Cloud just for this purpose may be a bit overblown. Google Cloud is just one way to do it. Use whatever fits best in your current infrastructure.
Now we can bring it all together
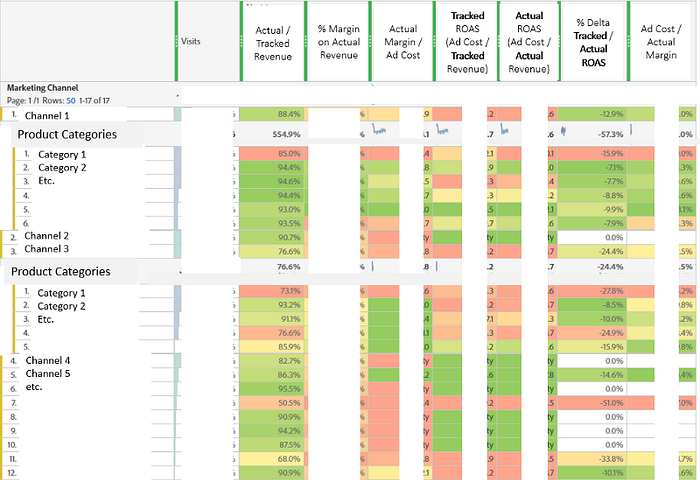
As shown in Part I, we now can analyze end-to-end: From the Campaign to the Bottom-Line Revenue AND — thanks to the special nature of Transaction ID Data Sources — we can link it to anything else users did. Here are the components again:
- Interactions tracked on the website (e.g. Orders, Revenue, Marketing Channels)
- Campaign Costs imported through Datacroft Campaign Importer matched to Tracking Codes (and thus to Marketing Channel)
- Actual Revenue and Profit Margins imported via Transaction ID Data Sources
And this just scratches the surface. Other questions that can now be answered in Analytics: What is the difference in Margin for Channel X between business or private clients? How does the margin vary by language (German or French)? How high is the margin for guests vs. new vs. returning customers? Do people who have successful On-Site Search Experiences not only shop more, but also reach higher margins? Etc. etc.
Epilogue: Other options to do this
Now if you actually read this far (thanks), you may wonder why we chose to import the data into Adobe Analytics in the first place and not go the other way: Export data from Adobe and merge it with other data in some Data Warehouse to analyze it all together e.g. in a Tableau Workspace?
Why not merge all the data in some DWH and analyze it with a BI tool like Tableau instead of importing it into Adobe Analytics?
This is definitely a worthy option, and it was also my first suggestion at the client, but due to the estimated cost and time to complete as well as their data team being very occupied, this was not possible anytime soon. The Adobe approach seemed lightweight enough and joined important data sources (and most importantly, the Visitor Profile!) like Cost and Campaign data which were not available in the BI data world yet, so this would have required even more work up-front on the BI side.
Which option you choose of course depends on your case, the customer’s existing BI infrastructure etc. It can also be done in addition to the Adobe imports, so it is definitely not an either-or option.
If you choose to go for the DWH/BI approach only, note that you lose all the flexibility of reporting within Adobe Analytics. You will rather easily get (probably Last-Click) campaign data into your BI tool, but you quickly want more than that. Customer Attributes / Product Classifications / other Website Behaviour / Search Terms / On-Site Campaigns etc.. All the stuff that can be correlated with a click and with usually good query speed inside of Adobe Analytics, but would need to be “re-generated” with a complex separate data model in a BI tool/DWH. Data Engineers may tell you this is no big deal, but I have not seen many (if any) BI reporting setups that came anywhere close to the functionality and speed of the Adobe Analytics interface.
Clients who want to go the BI route often end up in a giant project where you spend a lot of time, money (no chance without additional tool licenses and manpower) and processing power trying to merge the raw analytics data with your other datasets in some cluster. If you manage to do that merging, you still have to spend a lot of time and money customizing dashboards and reports in a way that normal people without SQL know-how can use them. Most of the time, you end up sacrificing some part of the Analytics data, so you will rarely get all data into one place, and your users will have to jump between tools depending on what data they want.
Of course, if you have the manpower, competence and longevity to go for a DWH-based solution, go for it. If you get it done, this offers huge potential for other data integrations, data products etc…
How do you do it?
So much on this topic. Time for your opinion: What do you think of this approach? Which tools / technologies do you use for your Cross-Channel Campaign Performance Analytics (e.g. Cost-based Analytics)? How do you make sure the Revenue you are tracking is actually a good predictor of the Actual Revenue? How do you measure Margins on Ad Spend?
Looking forward to your comments!