Why Adobe Analytics’ E-Commerce Data Model is Superior to Google’s
And why Adobe’s Product Management should not forget this
No data siloes, powerful segment-based metrics that work for both product- and non-product dimensions, product-specific attribution, offline data enrichments, all in an intuitive drag-and-drop interface that requires no tech skills to work with — why I think Adobe has the best offer for E-Commerce Analytics.
I had stopped engaging in these Adobe-vs-Google battles, because people (including myself) just seem to prefer the tools that they know, and then find enough reasons to back them up for whatever use case. But when it comes to E-Commerce Analytics, I have a really strong opinion about who is better. Some worrying trends in Adobe’s product development (scroll all the way to the bottom) made me just have to finally write this article.
Other reasons were people coming to Adobe from the Google world, being lost, missing “Enhanced E-Commerce”. To them, it seemed like Adobe had only “Basic E-Commerce” — after all, there is nothing branded as “Enhanced”.
I am of course not objective, but I have been setting up and working with several complex large E-Commerce implementations for both Google and Adobe for many years now. The bold claim:
If you are in E-Commerce, and if analysis capabilities are your only consideration, Adobe wins the battle hands down.
Read again: “your only consideration”! No decision for an Analytics solution depends on only one aspect, although analysis capabilities are certainly a main aspect.
“Enhanced” — only if compared to “Standard”
So it is basically Adobe’s E-Commerce capabilities compared to Google Analytics’ (GA) so-called “Enhanced E-Commerce”. Remember that GA’s model is only called “Enhanced” because there used to be only “Standard” GA E-Commerce, which simply means tracking nothing but “Transactions” (Orders). Adobe had all of GA’s “Enhanced” possibilities and more for a long time.
One problem with Adobe is that, apart from good, but expensive Adobe trainings, there is no such thing as a good official guide to Adobe E-Commerce with some standards and good examples that make it easy to get started, e.g. like GA’s wonderful demo shop (huge props to Google for that!).
And honestly, my impression is that the current Adobe Product team does not really get what they have with the current E-Commerce data model, maybe because it was created by people who no longer work at Adobe (scroll to the end).
I will use “Hit” and “Sub-Hit” a lot in the next paragraphs, so if this concept is new to you, scroll down to the end of this article for an explanation.
The most important reasons why I prefer Adobe’s E-Commerce capabilities:
1. Normal data and E-Commerce data do not live in separate silos
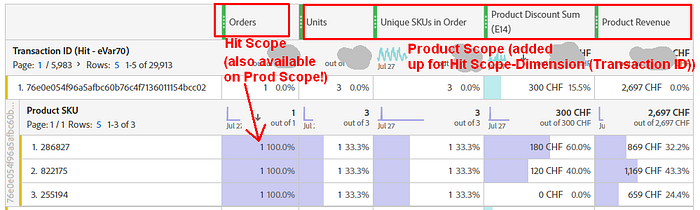
In GA, you constantly run into “but this cannot combined with that” problems. The main thing to understand here is: GA allows Sub-Hit Dimensions (Products) to be analyzed only with Sub-Hit (Product-Scoped) Metrics, while Adobe makes all Sub-Hit Dimensions inherit the Metrics that counted for the superordinated Hit [scroll all the way down for a visual example].
This sounds like nerd bullshit bingo, but it is essential. Because it is the reason why it is so hard to impossible to analyze products by non-product-scoped Metrics and vice-versa in GA. And thus, it is the driver for your analysis capabilities and for the extra implementation or BigQuery work needed.
Now enough theory. Some examples:


2. Product-specific Attribution a.k.a. “Merchandising eVars”
I am sitting in a training with some Category Managers, discussing Campaign and On-Site Search performance. We see that the Campaign “Google Shopping Electronics” had a Revenue of 1,000 CHF, and the Search Term “salad” led to a Revenue of 500 CHF. So naturally, they ask:
“So those 1,000 CHF were in the Electronics category, right? And the 500 CHF, they were spent on salads, correct?”
If you have worked in Analytics for E-Commerce, you have been asked this question many times. It is probably one of the top 3 questions I get.
And usually (and especially in GA), I have to say:
“No, cross-sales are included.”
So if people arrive through an electronics campaign and end up buying diapers, that diaper revenue gets attributed to the electronics campaign. Just like when they click on a salad in the search results for salad, but end up buying sausage.
Category Managers are primarily interested in the sales for their category/their brands etc., because that’s how they are incentivized and assessed. If they give Marketing money for search ads on salads, they understandably want the revenue of these ads to end up in their “salad bowl” as well. Likewise, the Search Engineer only sees her search results click as a success if the clicked product is also the one that is added to the basket.

Now you can (in Adobe easily, in GA if your report contains only Product Metrics) look at Campaign Revenue broken down by individual Products or Categories and thus see how much is cross-sales. But you have to do the weeding-out yourself. This is not the case with product-specific attribution, which is made possible through Adobe’s “Merchandising” variables.
For example, you can turn a search term into such a Merchandising variable. Then, the purchase and the revenue for search term “salad” will only count if the user who clicked e.g. a cucumber salad also bought that cucumber salad.
If the user searches again, but for “sausage”, then clicks on a Polish sausage and then buys both the cucmber salad and the Polish sausage, the search term “salad” gets the cucumber salad revenue and the “sausage” term gets the Polish sausage revenue.
Both purchases do not have to be within the same Visit: You can set “purchase” as the “Expiration Event”, and the search term will count for all interactions with the same product (not only purchase, but also Detail View, Add to Cart, Rate Product etc.) until a user either clicked another product for the same search term or finally buys it.


Sounds obvious? Yes, but it requires a ton of logic underneath (=a good data model) to make that happen, which is probably why Merchandising eVars support only the Attribution logic from its default settings (first-click, last-click or linear). Merchandising eVars are thus not too compatible with Attribution iQ, where the product-specific part goes away (cross-sales are included again). :(
Other examples: Product Finding Methods (how did people get to this product? Search? Google Shopping? Homepage Teaser? Category Navigation? Recommendation List?), Product Lists, Product Recommendation Algorithm etc…


In GA, there is only one dimension that allows such a Product-specific (but within-Session only) attribution: Product Lists. So what some clients do is that they clog everything into the Product List report (they make everything, even every search-term-list-combination, a “Product List”). A terrible workaround.
3. You are not forced to count everything per Hit only
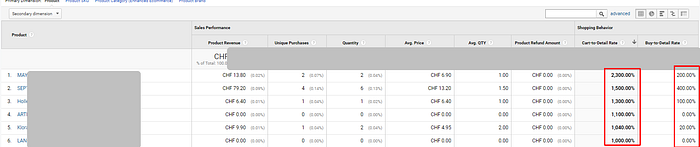
You want to see Product Detail Views for products / brands / categories / x counted once per Visit or Visitor? Impossible in GA. In practice, that means you e.g. count people 5 times if they need to view a product 5 times before they add it to the basket (rate of 20%), while someone else who adds the product right away will get a 100% rate. Or, if someone clicks “add to cart” 3 times to add 3 units to the cart, he will get a 300% cart add rate. Or how about 1000% and higher?
That is rarely what you want. Google Analytics also knows only Hit-based Custom Metrics, so you have no choice but to go to BigQuery and build something complex outside of GA. Agencies make a lot of money building reports e.g. in Data Studio with what could be simple stuff if the GA data model would allow it. And the new Google Analytics for Firebase (a.k.a. “Web + App”) is no better, as it does not even support Product-Scoped Custom Dimensions yet, which makes it useless for larger E-Commerce (more on the hyped, but unfinished product that is “Web + App”).
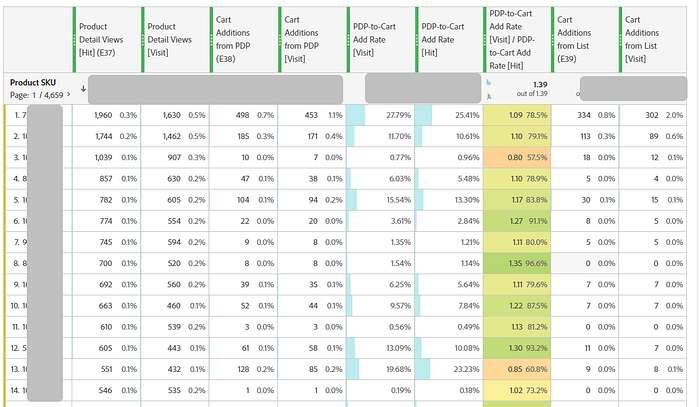
Large E-Commerce should normalize Metrics on a per-Visit level
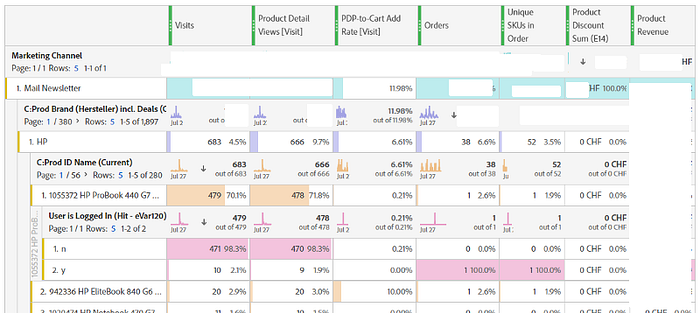
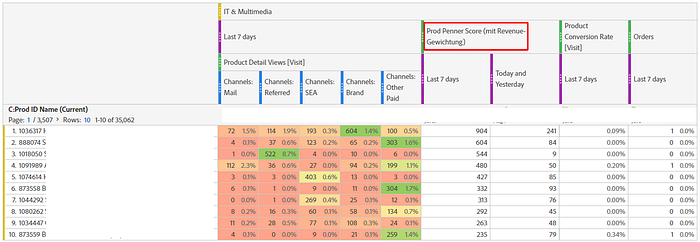
In Adobe, you can easily make anything count per Hit, per Visit (Session) or per User (how to) — even things like “per Visit of New Visitors” or “per Visit with Search Usage” are easily possible. In an E-Commerce shop where people tend to come back and buy multiple times, a Visit-based normalization of all E-Commerce metrics is the most sensible approach:
The problem grows exponentially for Product Categories/Lists etc.
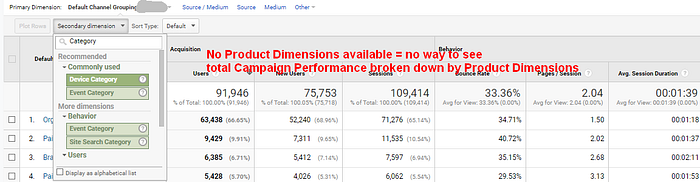
It gets only rougher if you want to view something like “Product Detail Views of a Product Category/Brand” or “Views of a Product List”. In GA, since it is all Product-Hit-based only, what you actually see when you view Product Detail Views for a Category is the sum of all Product Detail Views for all Products of this Category. This makes sense if you ask the question “how many Views of Product Detail Pages did I have within Category X, Y, Z?”, but it does not answer the more common question: “How many Sessions or Users viewed a Product of Category X, Y, Z?”.
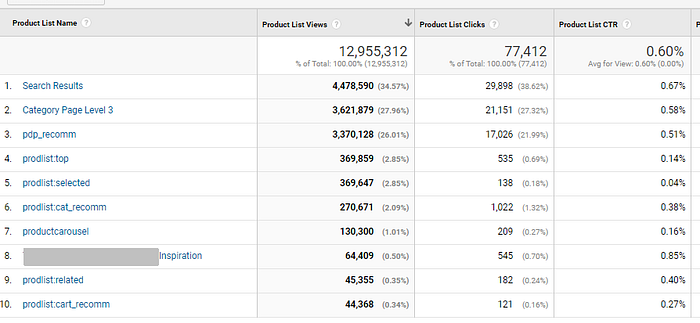
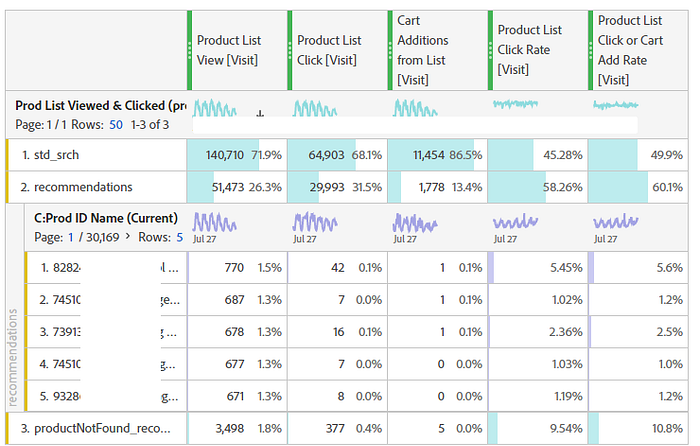
The meaningless List Click-Through Rate
Even worse is the case of Product Lists, where GA shows you the rather useless sum of all “Product Impressions” and misleadingly calls it “Product List Views”! It is not about List Views, instead it counts the number of Products shown within a list (e.g. if a List is viewed once and has 25 products in it, you get 25 “List Views”, not 1). This makes List Click-through Rates close to useless, and it favors Lists with few products in them (a list with 3 products is of course more likely to get a high CTR per product than a list with 50).
4. Offline Data Imports that are stitched into the Visitor Profile
The Transaction ID Data Sources allow you to import Offline Transactions, Refunds or Cancellations or even Profit Margins and Actual Revenue, which are then tied into the session when they happened (in GA’s case, e.g. refund imports are all attributed to “direct / none”).
5. Powerful Metrics to Rank “Winners and Losers”
I am a huge fan of Adobe’s segment-based Calculated Metrics, because you can condense so much complex info into a single column. My favorite examples are “Runners” and “Bummers”. These metrics allow to rank Products, Categories, Brands, Subcategories and even Campaigns, Search Terms and more depending on how well they turn their traffic into revenue.
See my article on “Runners and Bummers” for more.
6. Classifications a.k.a. endless free Custom Dimensions
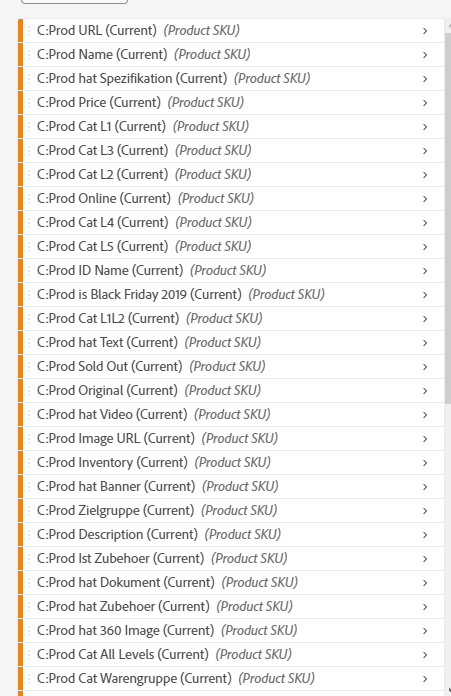
While Google has stopped support for Product-Scoped Custom Dimensions in their unfinished Web + App Analytics, in Adobe you can take one little key (the SKU) and import (manually or programmatically) as many “Classification” Dimensions. My main E-Commerce client has over 30 such Classifications. For example, While some departments prefer to work with the shop categories as they are displayed on the websites, others like to follow an internal categorization logic. Classifications easily allow to satisfy both needs without clogging more and more values into the Data Layer. See some examples here:
That being said, the “classic” GA does support data imports for Products, although it requires sacrificing a Custom Dimension for each of them (and making sure the imported data never goes above 2 GB which can be challenging for a large shop with hundreds of thousands of products). Still, I would not see this as a genuine advantage by Adobe over GA. See more on it in an older article of mine.
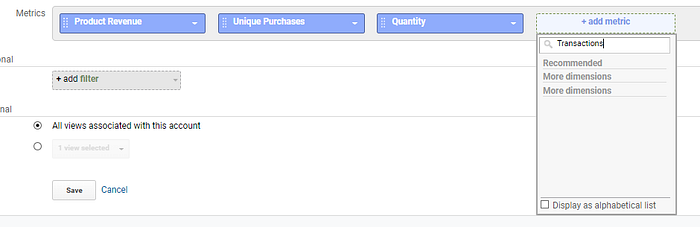
7. You are not forced to squeeze all potential product interactions into the GA standard metrics
Of course it is nice that GA has some built-in standard Product Metrics (Product Detail Views, List Clicks, Impressions, Add to Cart, Remove from Cart, Checkout, Purchase, Refund, Promotion Impression/Click). Even better, GA has some standard E-Commerce reports that make use of these metrics which make it easy to get started. But GA also forces you to use one of these Metrics for any product interaction you track, which means you have to sacrifice a standard Metric and add separate product-scoped metrics if you want to track anything that is not in the standard model: You cannot track a Custom Metric only!
This makes “Enhanced” E-Commerce feel a bit like “Reduced” E-Commerce, because there are sooo many ways to interact with a product (add to comparison list, rate, configure, add/remove from wishlist, add/remove service to product, enlarge product picture, etc… you get the idea). And if you sacrifice standard metrics, the standard reports and some built-in segments do not do anymore what they should do. If you e.g. sacrifice the “Add to Cart” Metric to also count Add to Wishlist/Shopping List/Comparison List, the Add to Cart Metric does not show anymore what its name says (Cart Additions). And people going to the standard reports will be misinterpreting them.
Final Notes: No tech skills or SQL queries needed
All the screenshots did not require me to export anything outside of Adobe Analytics, write an SQL query or work for hours or days building a specialized report. In the Adobe Analysis Workspace interface, it is a matter of a few minutes playing drag-and-drop.
That being said, again, getting started with E-Commerce is easier in Google than in Adobe, and a lot of messed-up Adobe E-Commerce implementations stem from the lack of understanding of how it all works, which again stems from the lack of good Adobe E-Commerce implementation guides and examples out there. This is where Adobe needs to step up. Maybe this article can give some inspiration.
Epilogue: A Primer on “Hits vs. Sub-Hits”
If you are not familiar with the fundamental Digital Analytics / Tracking concept of Hits and Sub-Hits, some parts in this article may have not meant much to you. So here you go:
- “Tracking” technically means sending an HTTP request to an Analytics tool’s data collection server with the data inside this request. This Request is (slightly imprecisely) called a “Hit”.
- Within a Hit, there can be “Sub-Hits”, e.g. when I have 2 Products in the cart on a Pageview request for a Checkout Step, that would be 2 Sub-Hits. Google knows sub-hits only for products. Adobe also allows you to declare some variables as “list variables”, so you can send e.g. “all the checkboxes checked in a form” in one Hit, with each checkbox then becoming its own Sub-Hit. In Google, you need to send a separate Hit for each checkbox.
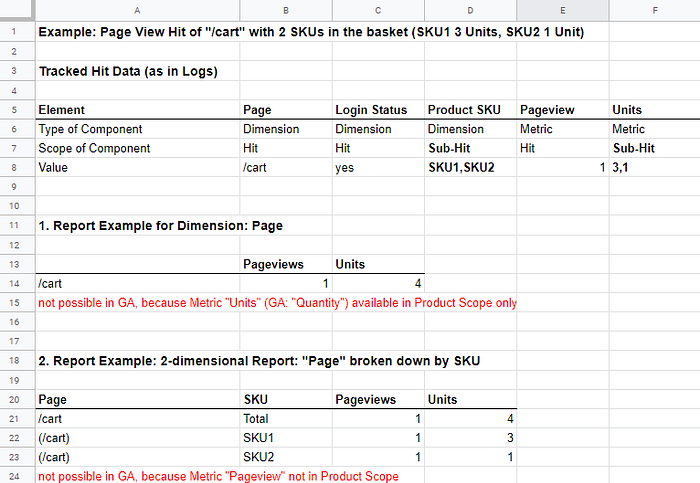
Since E-Commerce in most cases is all about those products (= sub-hit-level data), much depends on how your Analytics tool’s data model makes this sub-hit level data available. GA allows Sub-Hit Dimensions (Products) to be analyzed only with Sub-Hit (Product-Scoped) Metrics, Adobe makes all Sub-Hit Dimensions inherit the Metrics that counted for the superordinated Hit (=the Hit in which the Sub-Hits were collected). Likewise, Sub-Hit-scoped Metrics are summed up and deduplicated for Hit-level Dimensions.
Jen Lasser & Co., please hear my prayers!
That being said, my impression is that the Adobe Product Management team is not aware of the beauty of Adobe’s E-Commerce data model, because most of the new features (Mobile App, Segment filters for panels, Attribution iQ, Live Segmentation, etc.) were all built with no support for Sub-Hits. That lowers their value immensely for E-Commerce (e.g. nobody at my main client uses the mobile app because they cannot filter the data just for their product category). So please, Dr. Lasser, Dr. Matisoff & Co., do not forget that there are E-Commerce clients out there who are crazy about Sub-Hits!